Most conversations about generative engine optimization start with a boast: “We’re everywhere in AI.” This one starts with a measurement instead, because a real baseline is more useful than a flattering one.
In July 2026 we began working with our first pilot. Before we recommended a single change, before we wrote one line of content, we read what AI assistants already said about our first pilot. That reading is chapter one of the pilot, and it is the part almost nobody publishes, because a true baseline rarely says what you hope it will.
Why read the data before changing anything?
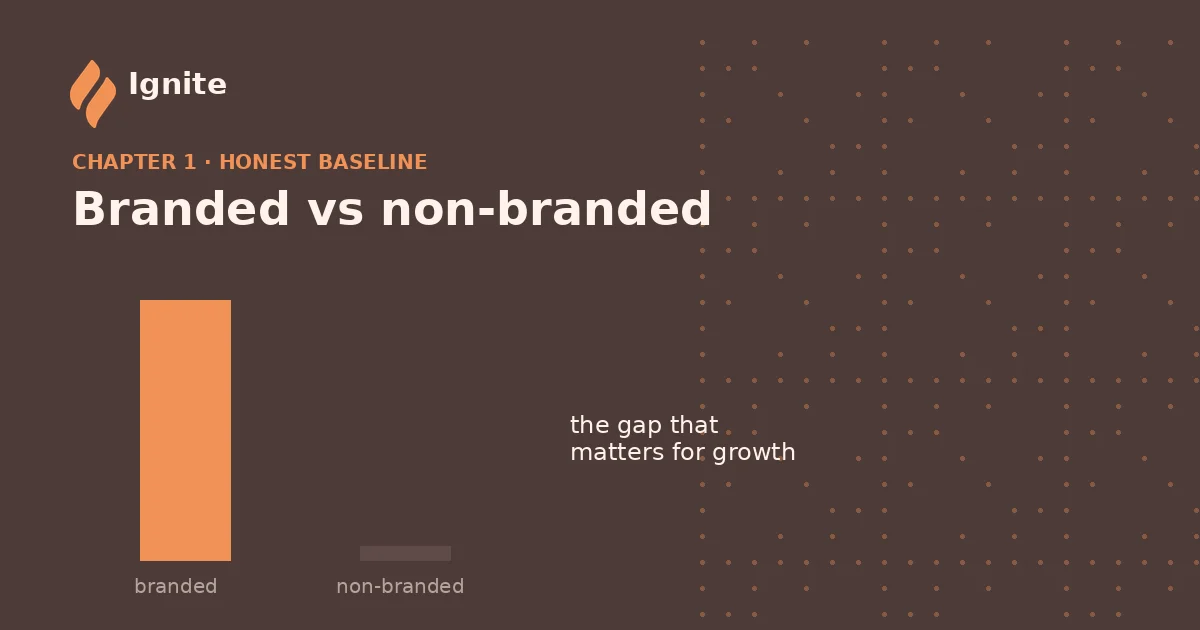
Because you cannot improve a position you have never measured. The first honest answer stung: in non-branded category questions, the kind a buyer asks before they know any provider by name, our first pilot appeared in 0 of 24 answers.[3]
Early in the engagement we sat with our first pilot’s own records, not our guesses about them: a twelve-month Google Search Console export, a Google Analytics and Firebase snapshot covering January to July 2026, and the crawl and citation logs already collected on their site. The question was narrow and deliberate. Not “how do we win,” but “where do we actually stand today.” A gap that size stays invisible until you agree to measure it.
What did the baseline actually reveal?
AI recommended our first pilot to people who already knew its name, and almost never to the people who did not. Split the blended mention rate into branded and non-branded, and for non-branded category questions our first pilot appeared in 0 of 24 answers.[3]
When AI assistants were asked about our first pilot by name, it showed up. Branded questions, though, are asked by people who already know you, so they are not where new customers come from.
This is why we treat the branded versus non-branded split as non-negotiable. A single blended “mention rate” can look healthy while hiding the fact that AI names you only to people who were going to find you anyway. Collapse the two together and “we’re everywhere in AI” survives. Split them, and for this one pilot, it did not.
How do you turn a first read into a measurable baseline?
You import the account’s history, then run live sweeps you can re-run and compare against. A working-session read is a start, not a baseline. To make it something we could measure change against, we brought our first pilot’s history into the platform a few days later, preserving the branded and non-branded split throughout. That backfill captured 15 tracked prompts, 783 recorded AI answer samples, 435 competitor mentions, and roughly 7,482 crawl events.[4] Those are this one pilot’s figures on that one day, not a benchmark any other business should expect to match.
Then we ran fresh baseline sweeps against live AI answers over a 21-day window. They grew the recorded answer samples from 783 to 1,658, populated the sources view from 0 to 2,553 grounded citations, and expanded the tracked prompt set from 15 to 31.[5] These are single-tenant baseline counts from one point in time. They measure how much ground we can now see, not a result we produced. Nothing about our first pilot’s actual standing improved in that step. We just made it visible enough to measure honestly going forward.
What does the research say we can actually move?
Published research gives us one tested lever: adding statistics, citations, and quotations to visible content. Aggarwal and colleagues, in their KDD 2024 paper on generative engine optimization,[1] found that this lifted answer visibility by 30 to 40% on their benchmark and by 22% Position-Adjusted Word Count. The scope rides with the number: visibility there means Position-Adjusted Word Count, how much of your own text an answer quotes back, not traffic, ranking, sales, or brand awareness. That 37% is the lever we are measuring against. It is not, and we will never present it as, a result this pilot achieved.
A companion finding shapes how we structure content. Liu and colleagues, in “Lost in the Middle” (TACL 2024),[2] showed that language models use information best when it sits at the start or end of the context and worst when it is buried in the middle, a U-shaped positional-use curve. The practical read is simple: lead with the canonical fact. That informs the how, once there is something worth changing.
Why is the baseline itself the product?
The baseline is the product because an honest first read is the only thing you can safely improve from. An accurate first read is not the boring preamble before the real work. The whole exercise is worthless if the numbers flatter you. Splitting branded from non-branded turned a comfortable story into a real one: our first pilot is recommended to people who already know it, and nearly invisible to the ones who do not, appearing in just 0 of 24 non-branded category answers.[3]
That is not a failure. It is a starting line, measured properly. The next chapters are about what we do with it, and how we prove whether anything actually moved.
References
- [1] Aggarwal et al., “GEO: Generative Engine Optimization,” KDD 2024: Adding statistics, citations, and quotations to visible content raised answer visibility by 30 to 40% on the GEO benchmark and 22% Position-Adjusted Word Count, where “visibility” is Position-Adjusted Word Count (how much of your own text an answer quotes back), not traffic, ranking, sales, or brand awareness. Cited here as the published lever we measure against, never a result achieved in this pilot. https://arxiv.org/abs/2311.09735
- [2] Liu et al., “Lost in the Middle: How Language Models Use Long Contexts,” TACL 2024: Language models tend to use information best when it sits at the start or end of the context and worst when buried in the middle, a qualitative U-shaped positional-use curve (no headline percentage). Basis for leading with the canonical fact. https://arxiv.org/abs/2307.03172
- [3] Our first pilot, baseline working session: Reading of the business’s own twelve-month Google Search Console export, a Google Analytics and Firebase snapshot for January to July 2026, and its citation and crawl logs. Core finding: the blended mention rate was mostly branded, and the non-branded category rate was 0 of 24 answers. This is our own first-party pilot measurement, a single point-in-time read, not a general result.
- [4] Our first pilot, history backfill: 15 tracked prompts, 783 recorded answer samples, 435 competitor mentions, and roughly 7,482 crawl events, with the branded and non-branded split preserved. Single-tenant figures for one day, our own measurement, not a benchmark any other business should expect to match.
- [5] Our first pilot, fresh baseline sweeps: Over a 21-day window, recorded answer samples grew from 783 to 1,658, grounded citations from 0 to 2,553, and the tracked prompt set expanded from 15 to 31. Single-tenant baseline counts from one point in time that reflect measurement coverage, our own first-party read, not an improvement in the business’s standing.